par admin » 25 sept. 2025, 21:56
- 8.png (50.3 Kio) Consulté 40910 fois
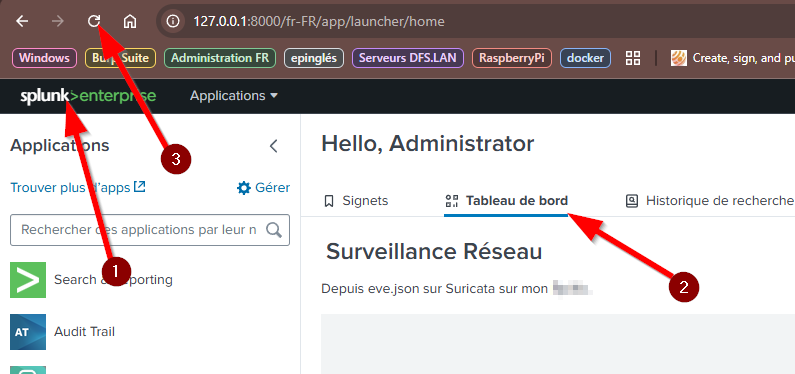
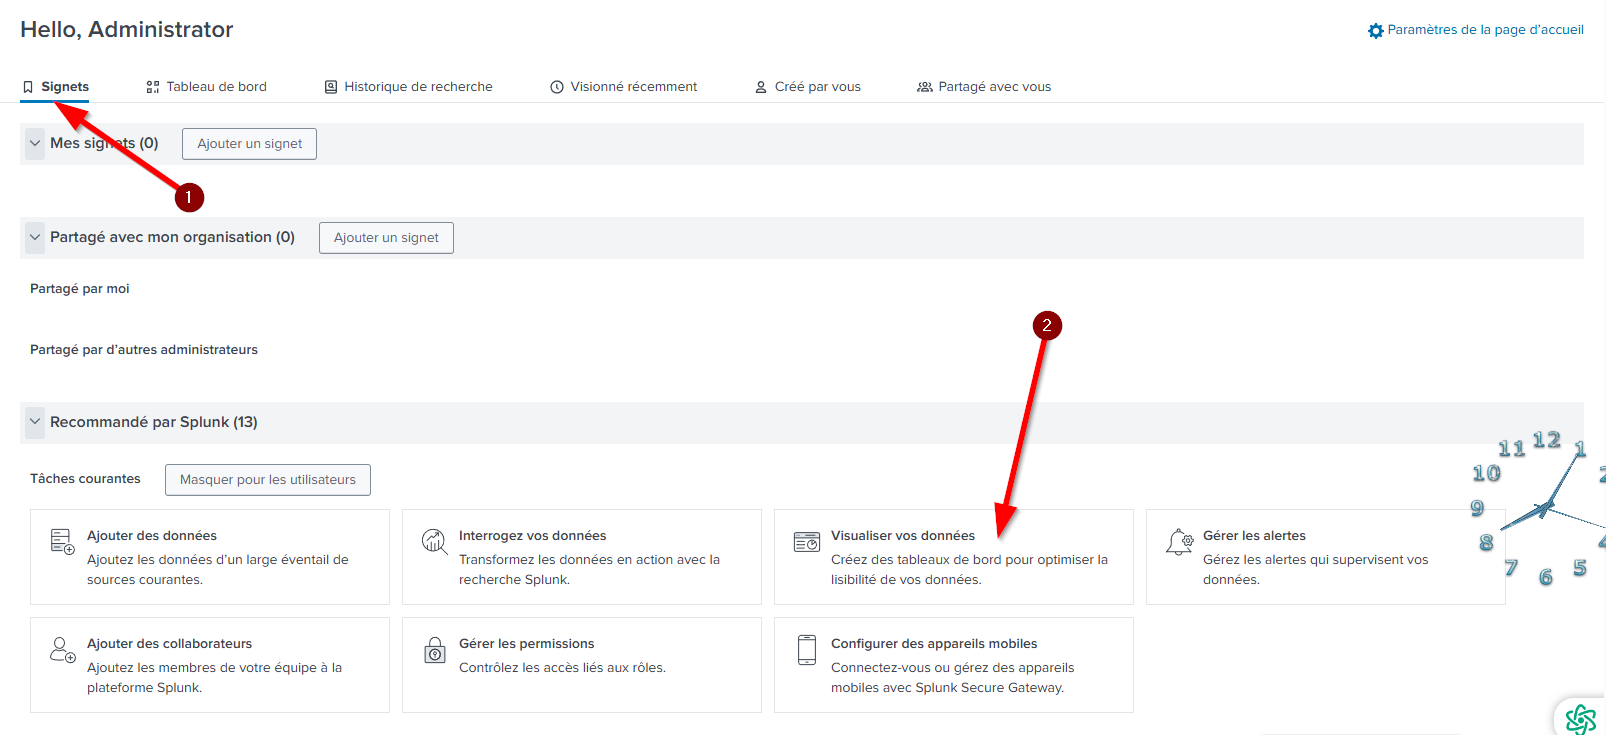
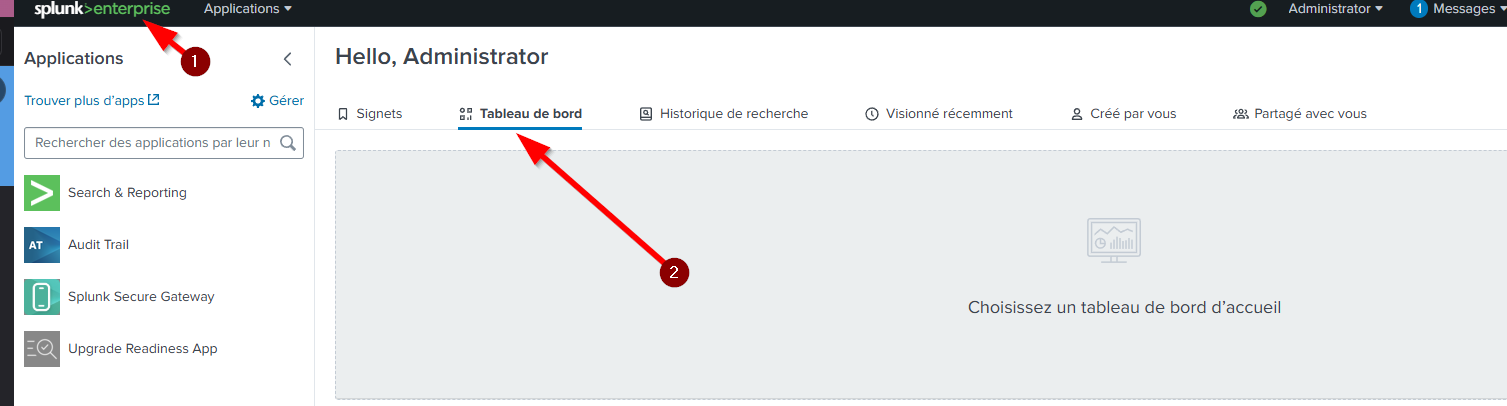
1) Cliquez ici, si pour revenir à la page d'accueil.
2) Choisir "tableau de bord"
Pour l'instant, il n'y a pas de tableaux de bord…
- 7.png (25.66 Kio) Consulté 40910 fois
- 6.png (31 Kio) Consulté 40910 fois
- 5.png (25.13 Kio) Consulté 40910 fois
- 4.png (47.18 Kio) Consulté 40910 fois
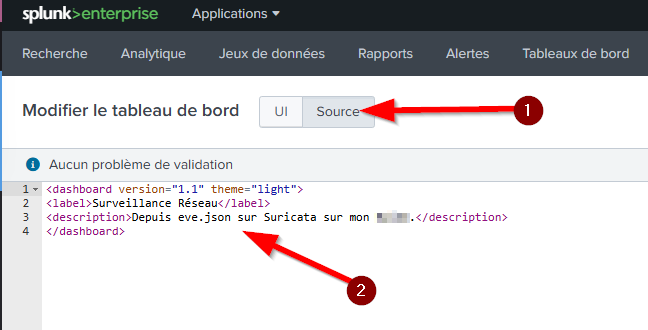
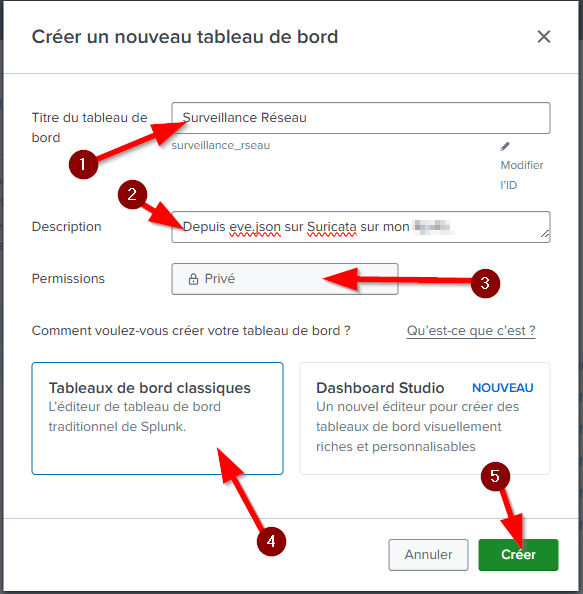
1) Choisir "Source"
2) Modifier le code XML comme suit :
Code : Tout sélectionner
		<dashboard version="1.1" theme="light">
		  <label>Surveillance Réseau</label>
		  <description>Depuis eve.json sur Suricata sur mon [PC]</description>

		  <row>
		    <panel>
		      <title>Top 10 adresses IP source</title>
		      <chart>
		        <search>
		          <query>index=main sourcetype=_json | stats count by src_ip | sort -count | head 10</query>
		        </search>
		        <option name="charting.chart">bar</option>
		      </chart>
		    </panel>

		    <panel>
		      <title>Top 10 types d’alertes</title>
		      <chart>
		        <search>
		          <query>index=main sourcetype=_json event_type=alert | stats count by alert.signature | sort -count | head 10</query>
		        </search>
		        <option name="charting.chart">pie</option>
		      </chart>
		    </panel>
		  </row>
		</dashboard>
- 3.png (14.15 Kio) Consulté 40910 fois
- 2.png (98.57 Kio) Consulté 40910 fois
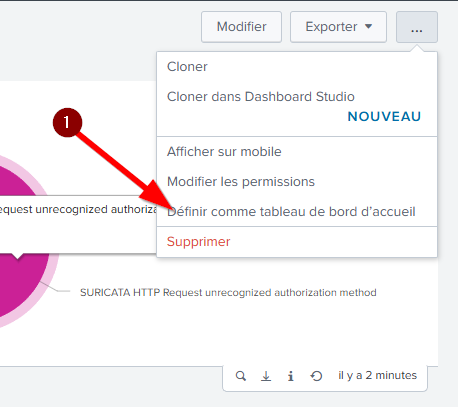
1) Cliquez sur le menu
2) Définissez le comme tableau de bord d'acceuil
- 1.png (51.67 Kio) Consulté 40910 fois
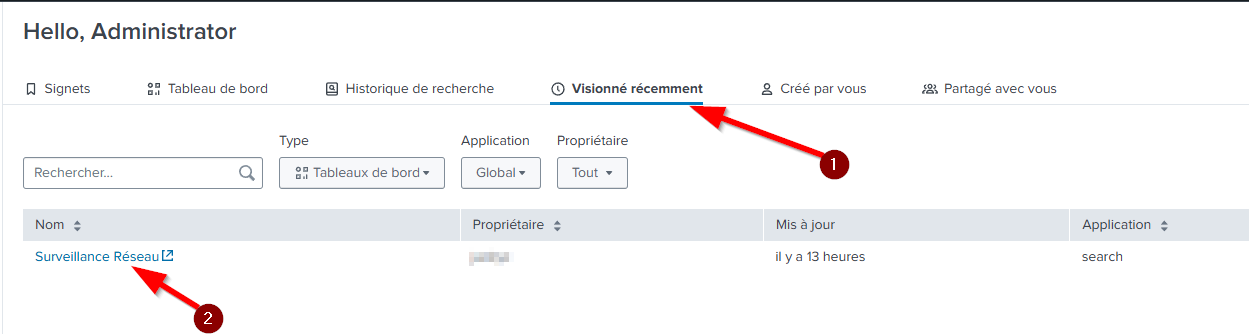
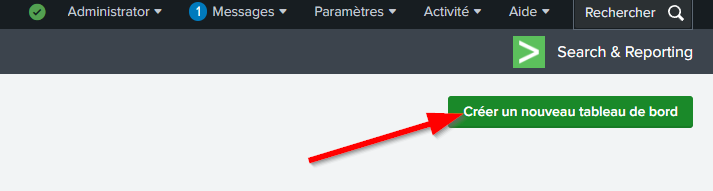
1) Revenez à l'accueil,
2) Cliquez ici
3) Actualisez la page
[attachment=7]1.png[/attachment]
1) Cliquez ici, si pour revenir à la page d'accueil.
2) Choisir "tableau de bord"
Pour l'instant, il n'y a pas de tableaux de bord…
[attachment=6]2.png[/attachment]
[attachment=5]3.png[/attachment]
[attachment=4]4.png[/attachment]
[attachment=3]5.png[/attachment]
1) Choisir "Source"
2) Modifier le code XML comme suit :
[code]
<dashboard version="1.1" theme="light">
<label>Surveillance Réseau</label>
<description>Depuis eve.json sur Suricata sur mon [PC]</description>
<row>
<panel>
<title>Top 10 adresses IP source</title>
<chart>
<search>
<query>index=main sourcetype=_json | stats count by src_ip | sort -count | head 10</query>
</search>
<option name="charting.chart">bar</option>
</chart>
</panel>
<panel>
<title>Top 10 types d’alertes</title>
<chart>
<search>
<query>index=main sourcetype=_json event_type=alert | stats count by alert.signature | sort -count | head 10</query>
</search>
<option name="charting.chart">pie</option>
</chart>
</panel>
</row>
</dashboard>
[/code]
[attachment=2]6.png[/attachment]
[attachment=1]7.png[/attachment]
1) Cliquez sur le menu
2) Définissez le comme tableau de bord d'acceuil
[attachment=0]8.png[/attachment]
1) Revenez à l'accueil,
2) Cliquez ici
3) Actualisez la page